Data analysis diagraph Grafiken und Clipart-Bilder


 —  Durchsuchen Sie 4448 data analysis diagraph-Grafiken aus unserer riesigen Bibliothek kostenloser Vektor- und 3D-Illustrationen in den Formaten PNG, SVG und GIF. Sie kommen alle mit transparentem Hintergrund für eine einfache Verwendung. Laden Sie eine hochwertige Illustration herunter, um kreative Ideen in ansprechende Bilder zu verwandeln. Sehen Sie sich auch unsere Top-Stile in 3D, Animiert und Trendy an.

AI
Nicht zufrieden?

Erstelle eine aus deiner Suche im Illustration Generator

Tablet displaying analytics dashboard with green bar chart data-Illustration im Organic-Stil als Download in PNG, SVG
Stack of reports with AI data analysis top view-Illustration im 3D Casual life-Stil als Download in PNG, SVG
Finance calculator and gear wheels for budget analysis efficiency-Illustration im 3D Business-Stil als Download in PNG, SVG
Analytics dashboard screen, business data visualization, financial metrics charts-Illustration im 3D Playful-Stil als Download in PNG, SVG
Pink bar chart icon, financial data metrics-Illustration im 3D Playful-Stil als Download in PNG, SVG
Data bar chart, financial metrics display, analytics visualization blue-Illustration im 3D Playful-Stil als Download in PNG, SVG
Ki-bot analysiert infografiken, datenvisualisierung und automatisierung-Illustration im 3D Enterprise-Stil als Download in PNG, SVG
Digitale datenschnittstelle mit grafiken, umsetzbare business-intelligence-tools-Illustration im Neat-Stil als Download in PNG, SVG
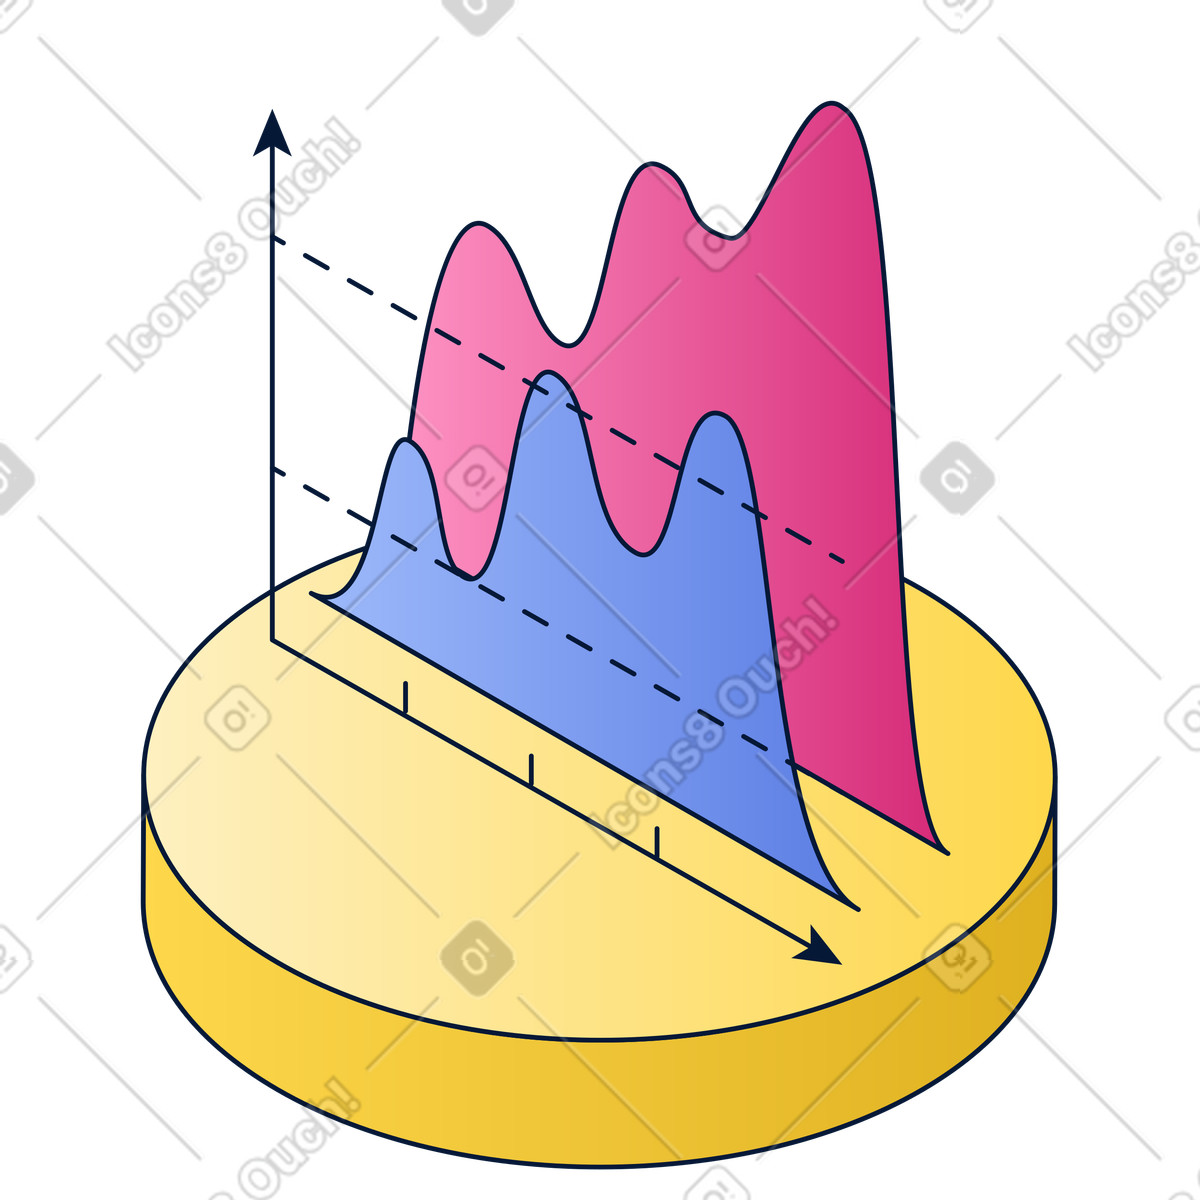
Layered area charts on platform, reporting and business trend analysis-Illustration im Neat-Stil als Download in PNG, SVG
Kuchendiagramm-Illustration im Neat-Stil als Download in PNG, SVG
Pie chart and metrics on dashboard, project performance tracking data reporting-Illustration im Neat-Stil als Download in PNG, SVG
Financial report document with line graph, data summary and business performance analysis-Illustration im Neat-Stil als Download in PNG, SVG
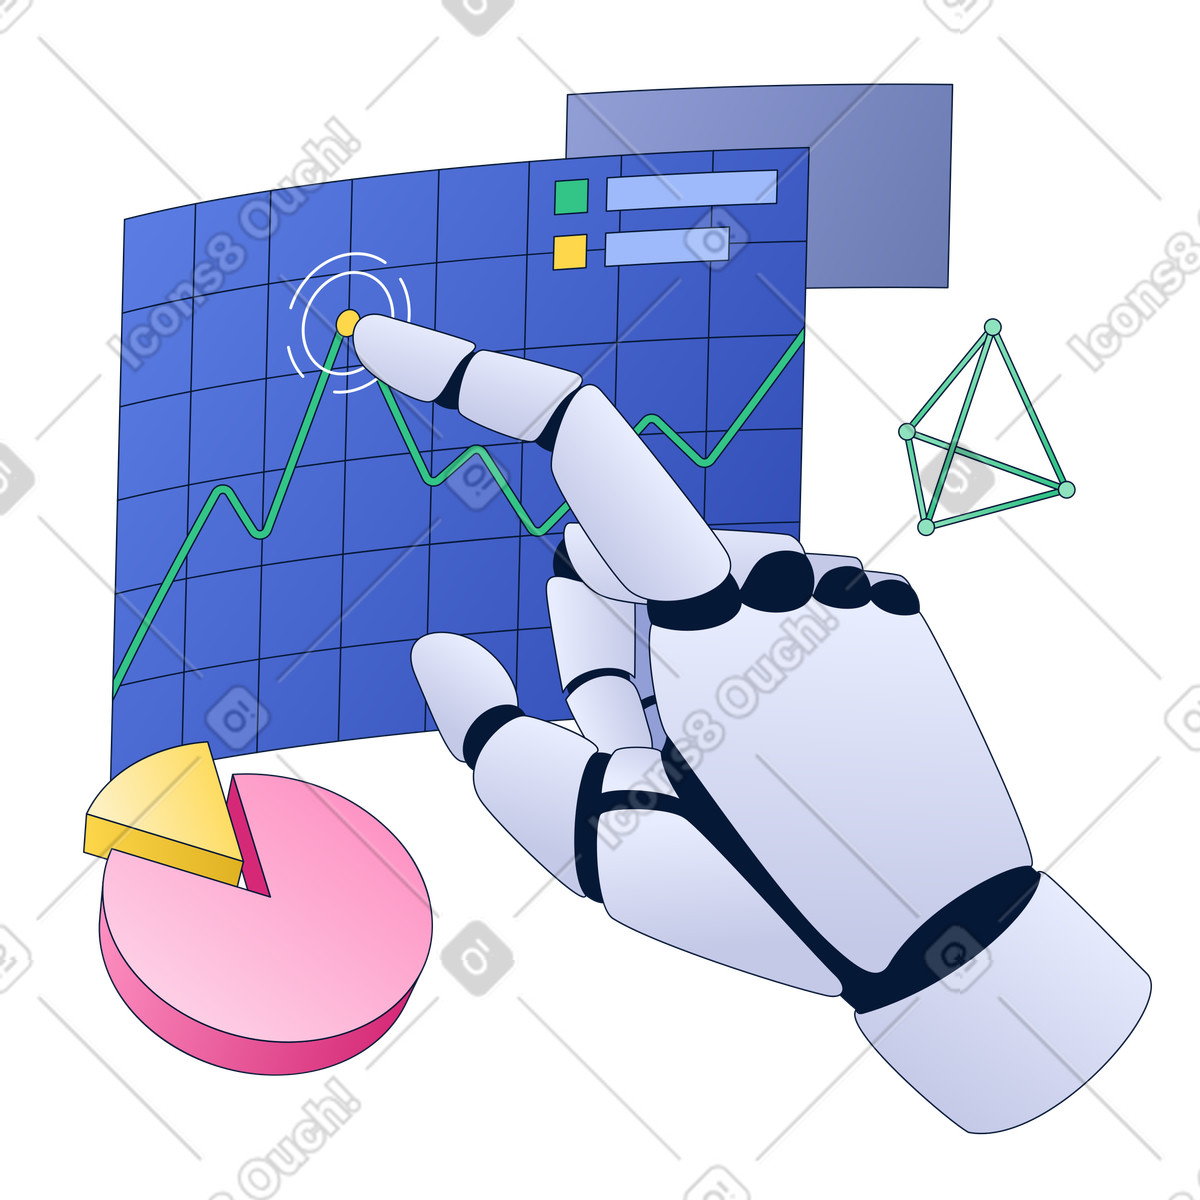
Roboterhand mit diagrammen, kreisdiagramm, ki-gestützter datenanalyse, künstlicher intelligenz in der finanzprognose-Illustration im Neat-Stil als Download PNG, SVG
Geschäftsdatenanalyse, kpi-tracking, analyse-dashboard auf dem tablet-Illustration im Neat-Stil als Download in PNG, SVG
Analyst presenting bar chart and pie data insights-Illustration im Notion Line Art-Stil als Download in PNG, SVG
Calculator device with pie chart symbol for financial data analysis-Illustration im Notion Line Art-Stil als Download in PNG, SVG
Pie chart segments divided into unequal slices for data comparison-Illustration im Notion Line Art-Stil als Download in PNG, SVG
Woman working with big data-Illustration im Journal-Stil als Download in PNG, SVG
Shield protecting pie chart data and confidential document files securely-Illustration im Organic-Stil als Download in PNG, SVG
Business analysis hands using calculator and magnifier with performance chart-Illustration im Watercolor sketch-Stil als Download in PNG, SVG
Statistics specialist arranging pie chart data with handdrawn percentage bars-Illustration im Ballpoint Pen-Stil als Download in PNG, SVG
Analytics data dashboard on futuristic dark screen for performance monitoring-Illustration im -Stil als Download in PNG, SVG
Mobile data analytics with futuristic infographics on smartphone-Illustration im -Stil als Download in PNG, SVG
Magnifying glass search symbol for online research and data exploration-Illustration im Main-Stil als Download in PNG, SVG
Statistics window displaying increasing area graph for data analysis report-Illustration im Main-Stil als Download in PNG, SVG
Performance metrics dashboard and laptop for online data reporting-Illustration im Main-Stil als Download in PNG, SVG
Pie chart with segments representing business data analysis and reporting-Illustration im Main-Stil als Download in PNG, SVG
Pie chart showing single highlighted segment for data analysis reports-Illustration im Main-Stil als Download in PNG, SVG
Analyse von verbraucherrezensionen und -bewertungen-Illustration im Isometric-Stil als Download in PNG, SVG
Ordner mit finanzanalyse-Illustration im Isometric-Stil als Download in PNG, SVG
Teacher explaining line graph data on classroom whiteboard-Illustration im System-Stil als Download in PNG, SVG
Aufschlüsselung von tortendiagrammen, datenverteilung, analysesegmentierung-Illustration im 3D Pro-Stil als Download in PNG, SVG
Search magnifying glass, Data analysis tool, Information lookup icon-Illustration im 3D Pro-Stil als Download in PNG, SVG
Financial data analysis on tablet dashboard with robotic hand-Illustration im 3D Pro-Stil als Download in PNG, SVG
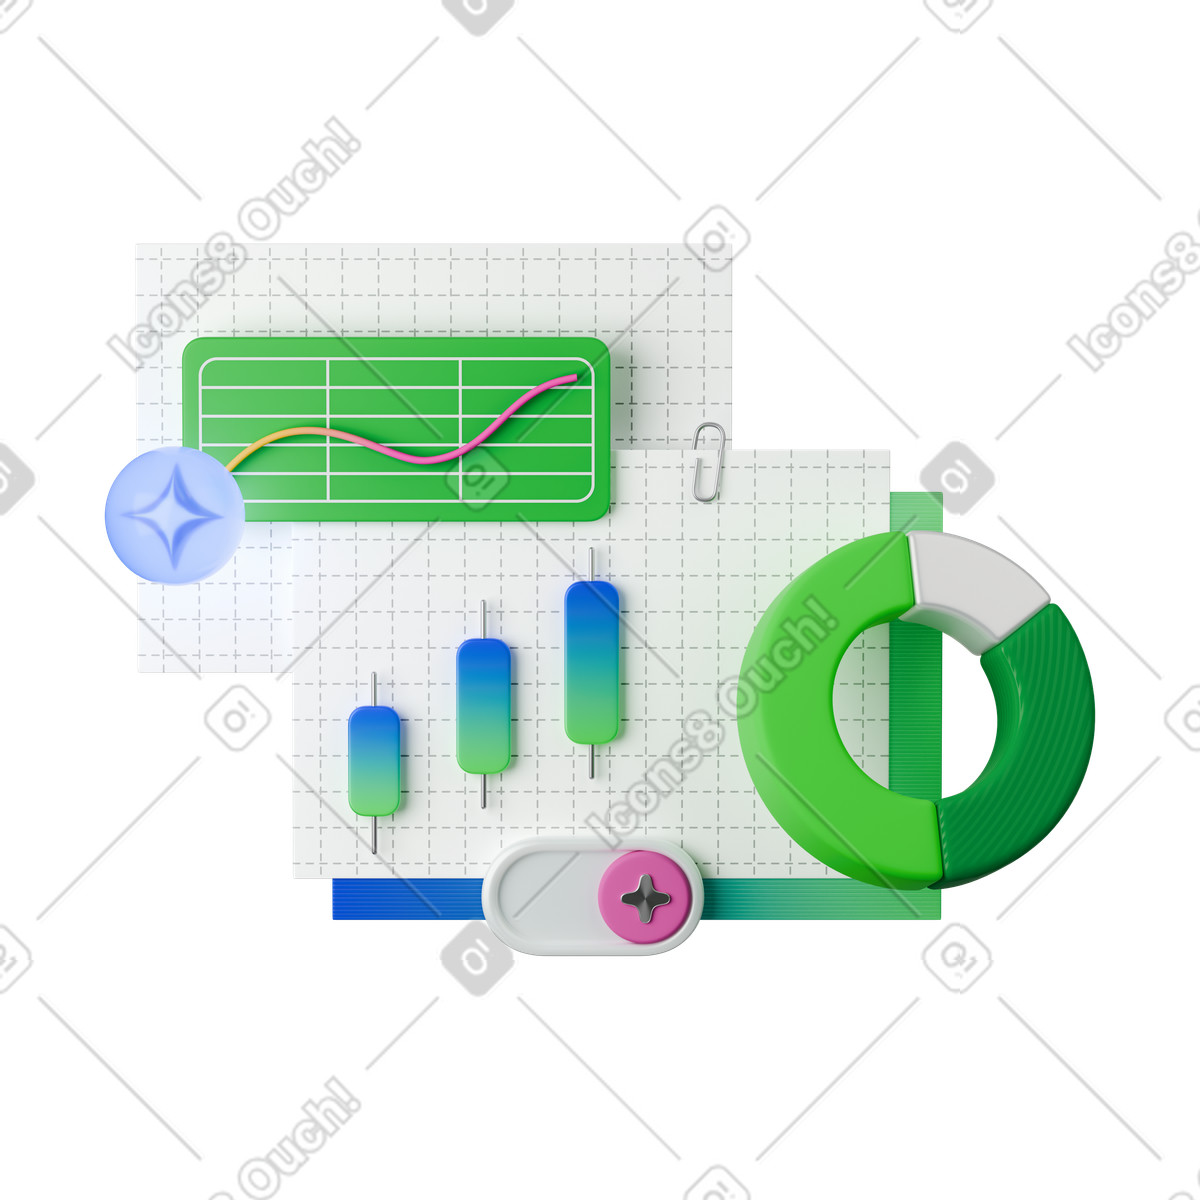
Analyse-dashboard, kontrollpanel für die geschäftsleistung, datenvisualisierungsschnittstelle-Illustration im 3D Pro-Stil als Download in PNG, SVG
AI financial data analysis on tablet with robotic hand-Illustration im 3D Pro-Stil als Download in PNG, SVG
Business data dashboard with sales analytics and tasks in progress-Illustration im 3D Pro-Stil als Download PNG, SVG
Financial analysis powered by ai technology on modern display-Illustration im 3D Pro-Stil als Download in PNG, SVG
Aufschlüsselung des donut-diagramms, datenverteilung, metriksegmentierung-Illustration im 3D Pro-Stil als Download in PNG, SVG
Dashboard circular analytics platform showing layered business data performance metrics-Illustration im 3D Pro-Stil als Download in PNG, SVG
Financial analysis-Illustration im 3D Microsoft Fluent illustration-Stil als Download in PNG, SVG
Data presentation with pie chart and segment highlight-Illustration im Inverse-Stil als Download in PNG, SVG